※ Details that are not on the homepage can be found in the SR report - Data sector.
| Categories | Unit | 2022 | 2023 | 2024 | |
|---|---|---|---|---|---|
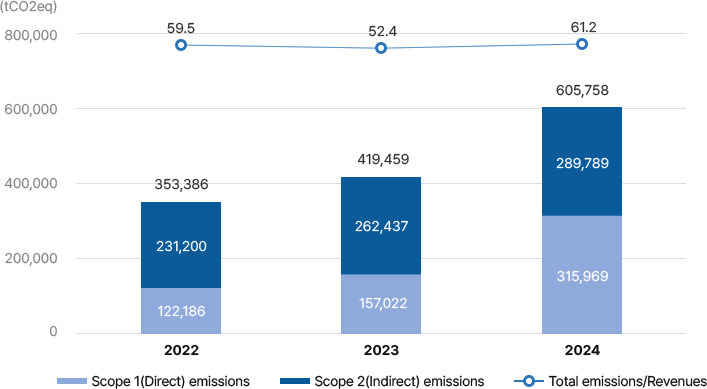
| Total emissions (Scope 1 + 2) | tCO2eq | 353,386 | 419,459 | 605,758 | |
| Scope 1(Direct) emissions | 122,186 | 157,022 | 315,9692) | ||
| Scope 2(Indirect) emissions | 231,200 | 262,437 | 289,789 | ||
| Total emissions/Revenues | tCO2eq/KRW billion | 59.5 | 52.4 | 61.23) | |
| Categories | Unit | 2022 | 2023 | 2024 | |
|---|---|---|---|---|---|
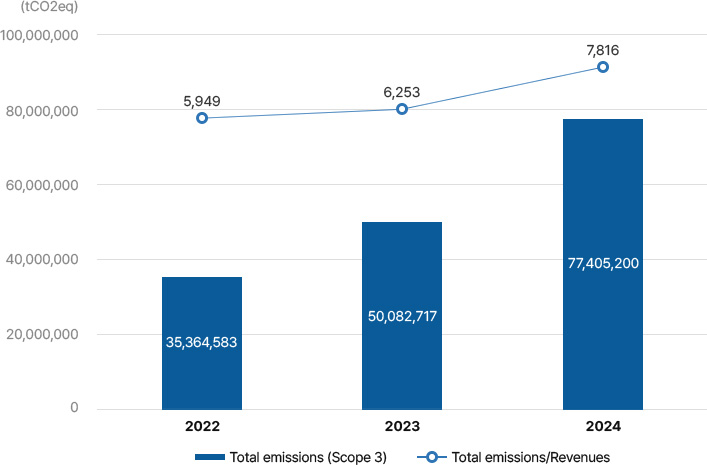
| Total emissions (Scope 3) | tCO2eq | 35,364,583 | 50,082,717 | 77,405,200 | |
| #1. Purchased goods and services | 4,087,391 | 4,293,256 | 3,873,565 | ||
| #2. Capital Goods | 2,745 | 7,622 | 10,332 | ||
| #3. Activities related to fuels and energies | 19,794 | 24,491 | 49,166 | ||
| #4. Upstream transportation and distribution | 12,596 | 7,121 | 8,690 | ||
| #5. Waste generated in operations | 3,455 | 6,652 | 9,109 | ||
| #6. Business travel | 684 | 845 | 914 | ||
| #7. Employee commuting | 2,500 | 4,944 | 6,229 | ||
| #8. Upstream leased assets | - | 1,357 | 1,042 | ||
| #11. Use of sold products | 31,230,651 | 45,670,245 | 73,346,773 | ||
| #12. End-of-life treatment of sold products | 4,767 | 66,010 | 99,179 | ||
| #13. Downstream leased assets | - | - | - | ||
| #15. Investments | - | 174 | 200 | ||
| Total emissions/Revenues | tCO2eq/KRW billion | 5,949 | 6,253 | 7,816 | |
| Categories | Unit | 2022 | 2023 | 2024 | |
|---|---|---|---|---|---|
| GHGs reduction contribution during ship operations | tCO2eq | 17,547,016 | 39,121,109 | 60,735,949 | |
| Categories | Unit | 2022 | 2023 | 2024 | |
|---|---|---|---|---|---|
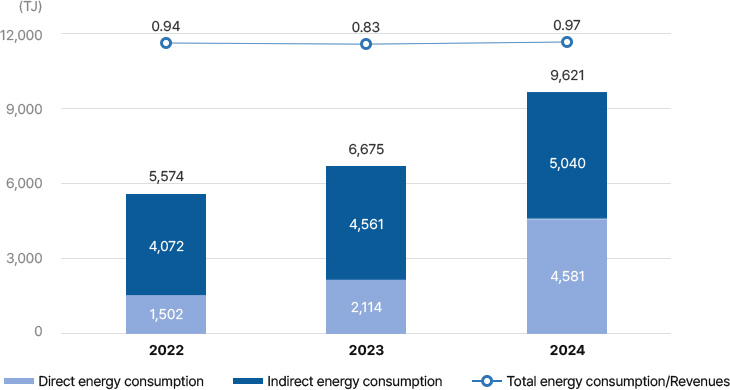
| Total energy consumption | TJ | 5,574 | 6,675 | 9,621 | |
| Direct energy consumption | 1,502 | 2,114 | 4,5817) | ||
| Indirect energy consumption | 4,072 | 4,561 | 5,040 | ||
| Total energy consumption/Revenues | TJ/KRW billion | 0.94 | 0.83 | 0.978) | |
| Unit | 2022 | 2023 | 2024 | |
|---|---|---|---|---|
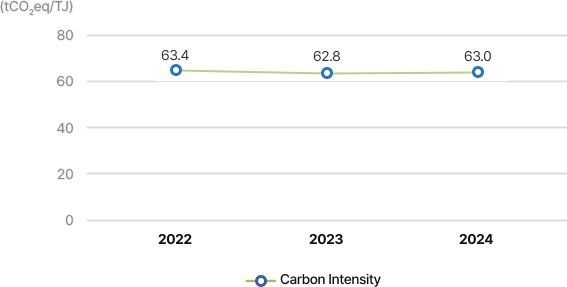
| Carbon Intensity9) | tCO2eq/TJ | 63.4 | 62.8 | 63.0 |
| Categories | Unit | 2022 | 2023 | 2024 | |
|---|---|---|---|---|---|
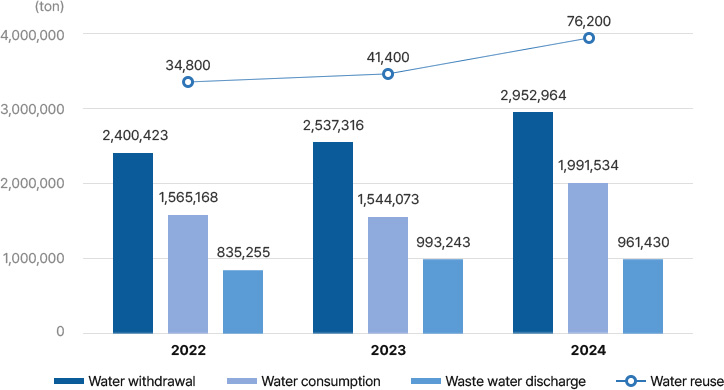
| Water withdrawal | ton | 2,400,423 | 2,537,316 | 2,952,964 | |
| Water withdrawn from water-stressed locations | - | - | 9,02311) | ||
| Waste water discharge | 835,255 | 993,243 | 961,430 | ||
| Water consumption | 1,565,168 | 1,544,073 | 1,991,534 | ||
| Water reuse | ton | 34,800 | 41,400 | 76,200 | |
| Categories | Unit | 2022 | 2023 | 2024 | |
|---|---|---|---|---|---|
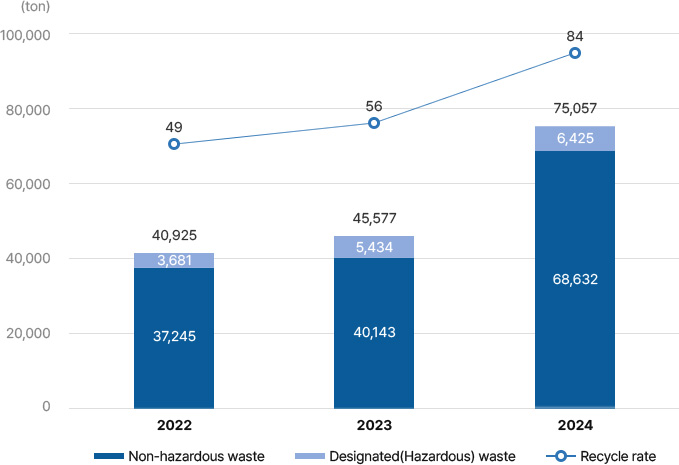
| Total waste | ton | 40,925 | 45,577 | 75,057 | |
| Recycling(External) | 19,885 | 25,729 | 62,928 | ||
| Incineration(Internal) | 14,113 | 10,020 | - | ||
| Incineration(External) | 1,224 | 3,588 | 3,979 | ||
| Landfill(External) | 5,704 | 6,239 | 8,150 | ||
| Non-hazardous waste | ton | 37,245 | 40,143 | 68,632 | |
| Recycling(External) | 18,192 | 23,728 | 59,872 | ||
| Incineration(Internal) | 14,015 | 9,963 | - | ||
| Incineration(External) | 19 | 584 | 613 | ||
| Landfill(External) | 5,019 | 5,868 | 8,146 | ||
| Designated(Hazardous) waste | ton | 3,681 | 5,434 | 6,425 | |
| Recycling(External) | 1,692 | 2,001 | 3,055 | ||
| Incineration(Internal) | 98 | 57 | - | ||
| Incineration(External) | 1,206 | 3,005 | 3,367 | ||
| Landfill(External) | 685 | 371 | 4 | ||
| Total waste/Revenues | ton/KRW billion | 6.88 | 5.69 | 7.58 | |
| Recycle rate | % | 49 | 56 | 84 | |
| Categories | Unit | 2022 | 2023 | 2024 | |
|---|---|---|---|---|---|
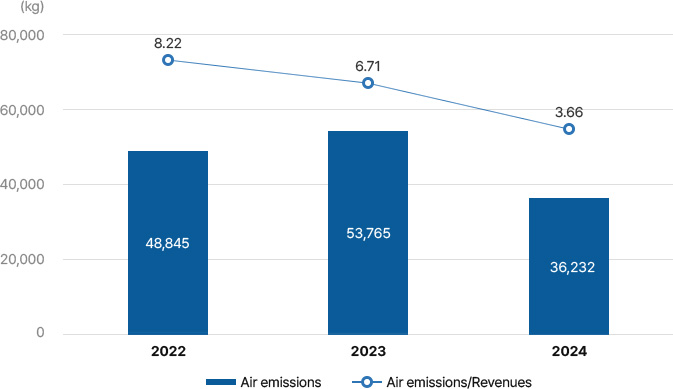
| Air emissions | ㎏ | 48,845 | 53,765 | 36,232 | |
| SOx(Sulfur oxides) | 2,828 | 2,160 | 598 | ||
| NOx(Nitrogen oxides) | 18,115 | 21,120 | 8,508 | ||
| TSP(Total suspended particulates) | 27,902 | 30,485 | 27,125 | ||
| Air emissions/Revenues | kg/KRW billion | 8.22 | 6.71 | 3.66 | |
| Categories | Unit | 2022 | 2023 | 2024 | |
|---|---|---|---|---|---|
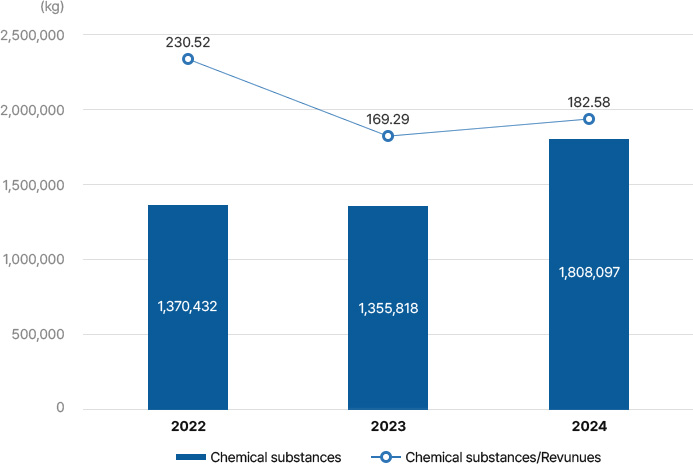
| Chemical substances | ㎏ | 1,370,432 | 1,355,818 | 1,808,097 | |
| 2-Propanol(CAS NO. 67-63-0) | 58,820 | 132,478 | 179,483 | ||
| Ethylbenzene(CAS NO. 100-41-4) | 250,277 | 239,206 | 325,064 | ||
| Toluene(CAS NO. 108-88-3) | 26,637 | 49,933 | 62,776 | ||
| Xylene(CAS NO. 1330-20-7) | 1,015,724 | 900,938 | 1,201,098 | ||
| Ethylene(CAS NO. 74-85-1) | 18,974 | 22,953 | 25,759 | ||
| Methyl ethyl ketone(CAS NO. 78-93-3) | - | 10,310 | 13,918 | ||
| Chemical substances/Revenues | kg/KRW billion | 230.52 | 169.29 | 182.58 | |
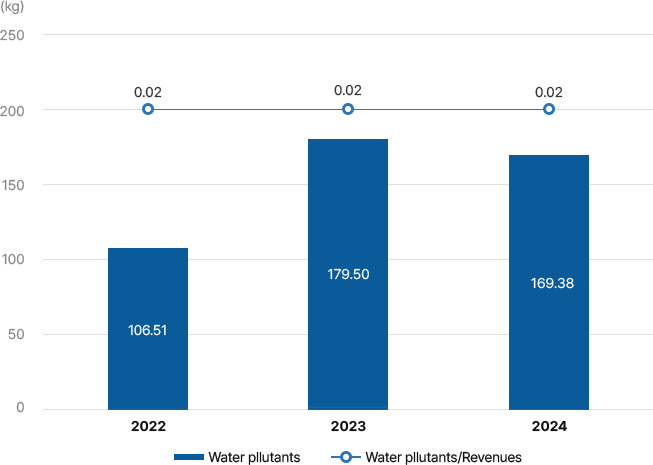
| Categories | Unit | 2022 | 2023 | 2024 | |
|---|---|---|---|---|---|
| Water pollutants | ㎏ | 106.51 | 179.50 | 169.38 | |
| BOD(Biochemical oxygen demand) | 12.71 | 18.40 | 19.88 | ||
| COD(Chemical oxygen demand) | - | 55.30 | 49.01 | ||
| T-N(Total nitrogen) | 32.60 | 48.30 | 43.33 | ||
| T-P(Total phosphorus) | 0.70 | 1.40 | 0.97 | ||
| TOC(Total organic carbon) | 19.20 | 37.30 | 20.11 | ||
| SS(Suspended solids) | 8.10 | 14.90 | 27.14 | ||
| NH3-N(Ammonia nitrogen) | 32.60 | - | - | ||
| F(Fluorine) | - | 0.30 | 5.05 | ||
| Heavy metals | 0.60 | 3.60 | 3.88 | ||
| Water pollutants/Revenues | kg/KRW billion | 0.02 | 0.02 | 0.02 | |
| Categories | Unit | 2022 | 2023 | 2024 | |
|---|---|---|---|---|---|
| Eco-investing | Total | KRW million | 14,892 | 16,469 | 39,632 |
| Operational expenses | 10,662 | 11,154 | 14,672 | ||
| Capital expenditure | 3,950 | 5,030 | 24,675 | ||
| Post-investigation of environmental impacts | 280 | 285 | 285 | ||
| Investment to revenue ratio | % | 0.25 | 0.21 | 0.40 | |
| Environmnetal due diligence | Number | 9 | 9 | 15 | |
| Education | Total | Hr | 120,806 | 158,218 | 153,943 |
| Training hours per person | 6.0 | 6.0 | 6.2 | ||
| Categories | Unit | 2022 | 2023 | 2024 | |
|---|---|---|---|---|---|
| Environmental compliance | Violations | Cases | - | - | - |
| Environmental accidents | Cases | - | - | - | |
| Fines | KRW | - | - | - | |
| Administrative penalties | KRW | - | - | - | |
| Non-monetary sanctions | Cases | - | - | - | |
| Damages | KRW | - | - | - | |
| Stakeholders | Complaints | Cases | - | - | - |
| Resolution rate | % | - | - | - | |
| Monetary compensation | KRW | - | - | - | |
| Categories | Unit | 2022 | 2023 | 2024 | |
|---|---|---|---|---|---|
| Habitat protection | Protected and restoration habitats | Sites | 4 | 4 | 3 |
| Species identification | Endangered species | Species | 2 | 2 | 1 |
| Protected species | Species | 51 | 63 | 61 | |
| Categories | Unit | 2022 | 2023 | 2024 | |
|---|---|---|---|---|---|
| Employee | Total | Persons | 8,775 | 9,640 | 11,951 |
| By gender | Male | 8,457 | 9,255 | 11,370 | |
| Female | 318 | 385 | 581 | ||
| By entity | Korea | 8,748 | 8,696 | 8,655 | |
| Asia | 27 | 944 | 3,213 | ||
| America | - | - | 5 | ||
| Africa | - | - | 77 | ||
| etc. | - | - | 1 | ||
| By contract type | Executive | 36 | 38 | 39 | |
| Permanent | 8,544 | 8,389 | 8,391 | ||
| Temporary | 195 | 1,213 | 3,521 | ||
| By age group | Under 30 | 279 | 558 | 930 | |
| 30 to under 50 | 5,910 | 6,165 | 7,648 | ||
| 50 and over | 2,586 | 2,917 | 3,373 | ||
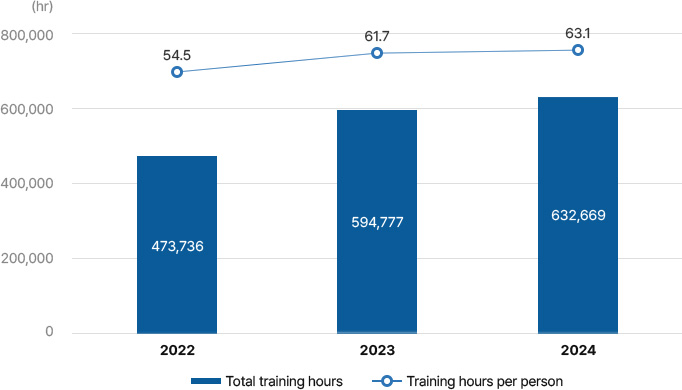
| Categories | Unit | 2022 | 2023 | 2024 | |
|---|---|---|---|---|---|
| Training hours | Total training hours | hr | 473,736 | 594,777 | 632,669 |
| Training hours per person | 54.5 | 61.7 | 63.1 | ||
| Training categories | Talent nurturing | 207,591 | 220,514 | 211,035 | |
| Human rights | 21,995 | 21,853 | 30,287 | ||
| Environment | 52,650 | 64,834 | 54,208 | ||
| Safety | 132,181 | 206,213 | 210,116 | ||
| Compliance | 37,135 | 55,052 | 53,027 | ||
| Quality | 2,380 | 2,100 | 7,977 | ||
| Engineering | 18,360 | 20,280 | 38,052 | ||
| Security | 1,444 | 3,931 | 27,967 | ||
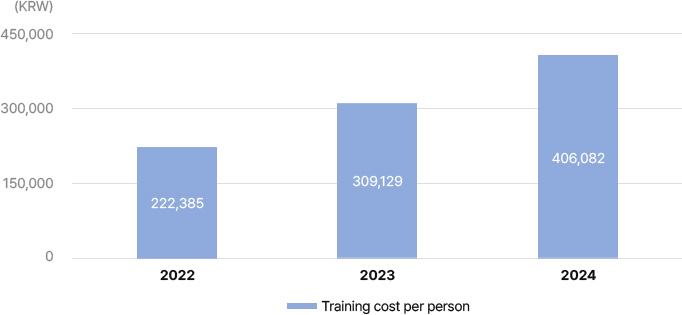
| Traning cost | Traning cost per person | KRW | 222,385 | 309,129 | 406,082 |
[ Supplier identification ]
[ Purchase cost ]
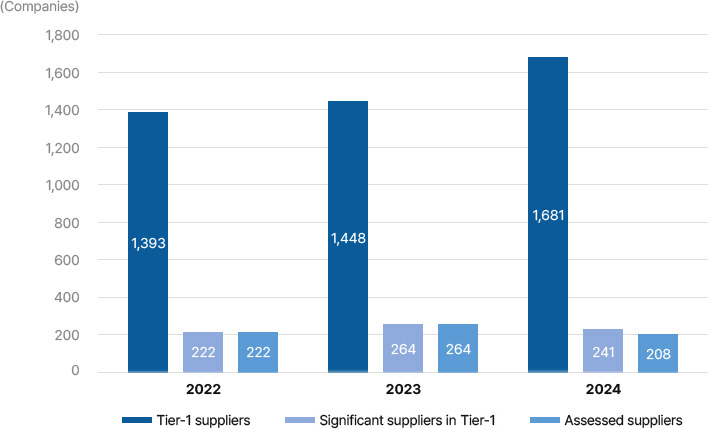
| Categories | Unit | 2022 | 2023 | 2024 | |
|---|---|---|---|---|---|
| Supplier identification | Tier-1 suppliers | Companies | 1,393 | 1,448 | 1,681 |
| Significant suppliers in Tier-14) | 222 | 264 | 241 | ||
| Supplier assessment | Assessed suppliers | 222 | 264 | 208 | |
| High-risk suppliers5) | 9 | 11 | 5 | ||
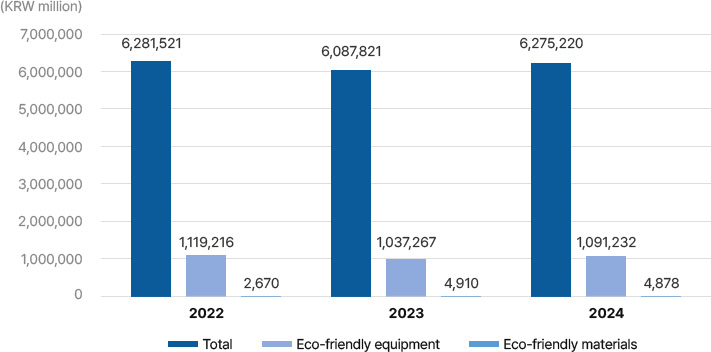
| Purchase cost | Total | KRW million | 6,281,521 | 6,087,821 | 6,275,220 |
| Eco-friendly materials | 2,670 | 4,910 | 4,878 | ||
| Eco-friendly equipment | 1,119,216 | 1,037,267 | 1,091,232 | ||
[ Training support ]
[ Financial support ]
| Categories | Unit | 2022 | 2023 | 2024 | |
|---|---|---|---|---|---|
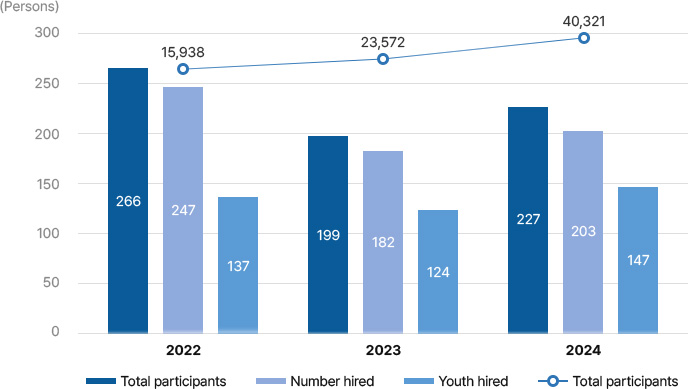
| Educational support | Total participants | Persons | 15,938 | 23,572 | 40,321 |
| Quality | 20 | 40 | 44 | ||
| Safety | 13,543 | 20,087 | 22,606 | ||
| Job training | 2,375 | 3,445 | 17,671 | ||
| Talent nurturing | Total participants | 266 | 199 | 227 | |
| Career opportunities | Number hired | Persons | 247 | 182 | 203 |
| Youth hired | 137 | 124 | 147 | ||
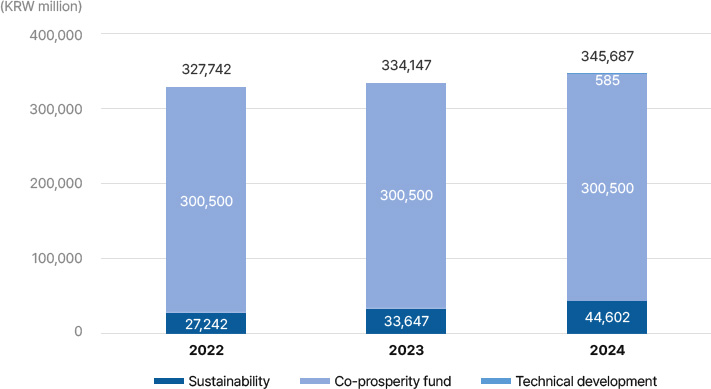
| Financial support | Sustainability | KRW million | 27,242 | 33,647 | 44,602 |
| Co-prosperity fund | 300,500 | 300,500 | 300,500 | ||
| Technical development | - | - | 585 | ||
| Business support | Cash payment monitoring7) | KRW million | 591,200 | 569,300 | 589,100 |
| Categories | Unit | 2022 | 2023 | 2024 | |
|---|---|---|---|---|---|
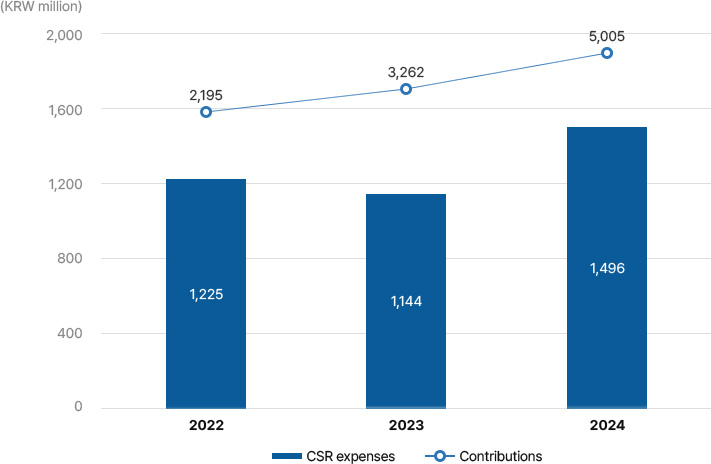
| CSR expenses | Total | KRW million | 1,225 | 1,144 | 1,496 |
| Company | 574 | 515 | 830 | ||
| Employee | 651 | 629 | 666 | ||
| Contributions | KRW million | 2,195 | 3,262 | 5,005 | |
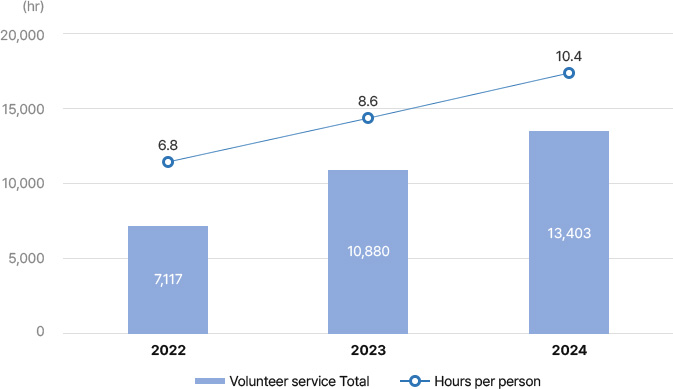
| Volunteer service | Total | Hr | 7,117 | 10,880 | 13,403 |
| Hours per person | 6.8 | 8.6 | 10.4 | ||
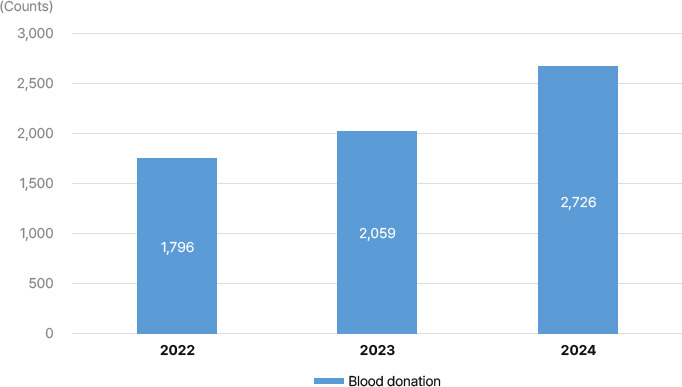
| Blood drive | Blood donation | Counts | 1,796 | 2,059 | 2,726 |
| Categories | Unit | 2022 | 2023 | 2024 | |
|---|---|---|---|---|---|
| Safety activities | Safety improvement | Cases | 66,461 | 70,923 | 86,053 |
| Emergency drills | Counts | 214 | 268 | 330 | |
| Safety indicators | Accident rate | Persons/ Total employee |
0.30 | 0.21 | 0.13 |
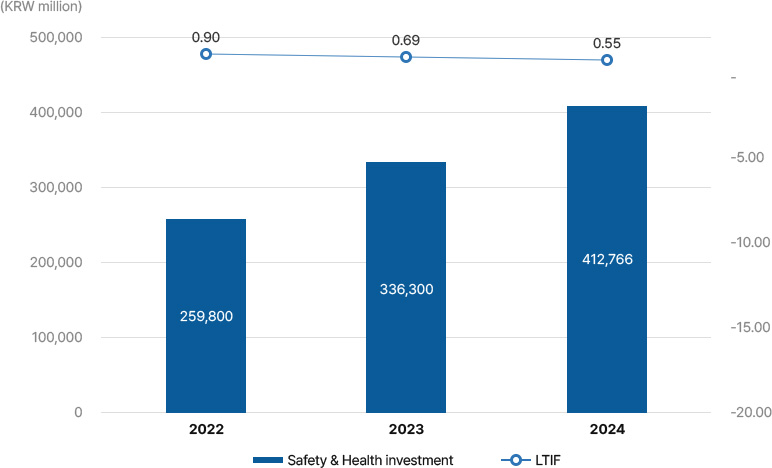
| LTIF10) | Cases/Million hr | 0.90 | 0.69 | 0.55 | |
| TRCF11) | 2.90 | 2.37 | 1.94 | ||
| Safety award programs | KRW million | 152 | 162 | 207 | |
| Safety & Health investment12) | KRW million | 259,800 | 336,300 | 412,766 | |
| Categories | Unit | 2022 | 2023 | 2024 | |
|---|---|---|---|---|---|
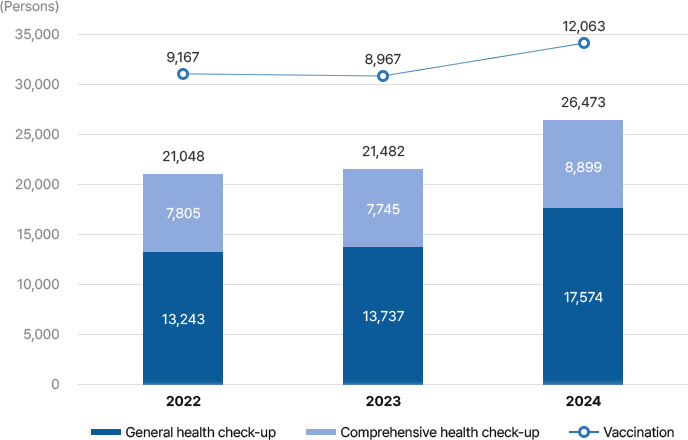
| Health examination | Total | Persons | 21,048 | 21,482 | 26,473 |
| General health check-up | Persons | 13,243 | 13,737 | 17,574 | |
| Comprehensive health check-up | 7,805 | 7,745 | 8,899 | ||
| Health care support | In-house medical center | Counts | 34,783 | 32,621 | 15,309 |
| Vaccination | 9,167 | 8,967 | 12,063 | ||
| Smoking cessation clinic | Persons | - | 665 | 618 |
Information related to the board of directors can be found on the 'Investment Information-Governance-Board of Directors' section of the company's website.
| Categories | Unit | 2022 | 2023 | 2024 | |
|---|---|---|---|---|---|
| Compliance consultation | Total | Cases | 536 | 423 | 378 |
| Fair trading | 147 | 140 | 119 | ||
| Anti-corruption | 60 | 62 | 140 | ||
| etc. | 329 | 221 | 119 | ||
| Legal consultation | Total | Cases | 1,171 | 1,174 | 1,066 |
| Contract review | 942 | 966 | 867 | ||
| etc. | 229 | 208 | 199 | ||
| Compliance education | Total | Hr | 37,135 | 55,052 | 53,318 |
| Training hours per person | 0.8 | 1.1 | 1.1 | ||
| Internal audit and remediation | Violation of the code of conduct/ethics |
Cases | 23 | 32 | 10 |
| Disciplinary action for corruption |
23 | 32 | 10 |
| Categories | Unit | 2022 | 2023 | 2024 | |
|---|---|---|---|---|---|
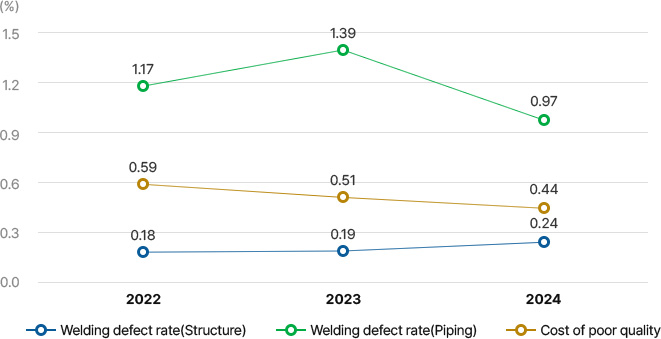
| Welding defect rate(Structure) | % | 0.18 | 0.19 | 0.24 | |
| Welding defect rate(Piping) | 1.17 | 1.39 | 0.97 | ||
| Cost of poor quality | % | 0.59 | 0.51 | 0.44 | |
| Inspection acceptance rate(Process) | % | 99.5 | 99.6 | 99.5 | |
| Inspection acceptance rate(Mechanical completion) | 100.0 | - | 99.1 | ||
| NO. of punch3) list per ship | Cases/ship | 38,958(Cases) | 1,196 | 1,381 | |
| Average punch3) clearance period | Days | 6.0 | 7.7 | 5.0 | |
| Categories | Unit | 2022 | 2023 | 2024 | |
|---|---|---|---|---|---|
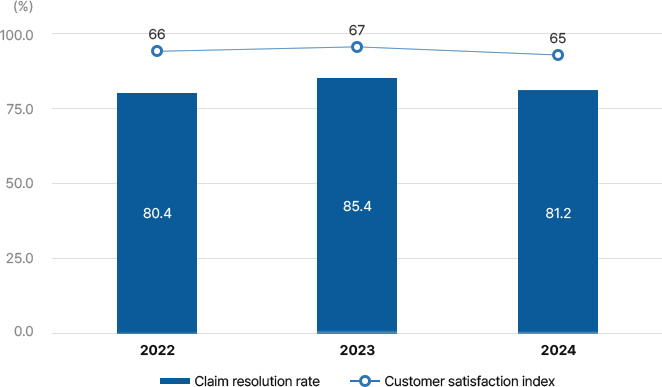
| Customer satisfaction index | Average score | score | 66 | 67 | 65 |
| Participating client companies | Companies | 16 | 17 | 15 | |
| Customer claim resolution | Claim resolution rate | % | 80.4 | 85.4 | 81.2 |
| Average time to resolve claims | Days | 41.0 | 42.0 | 39.3 |
| Categories | Unit | 2022 | 2023 | 2024 | |
|---|---|---|---|---|---|
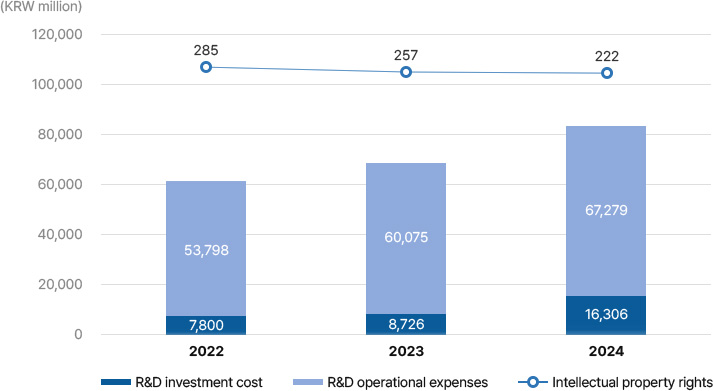
| R&D investment cost | KRW million | 7,800 | 8,726 | 16,306 | |
| R&D operational expenses | KRW million | 53,798 | 60,075 | 67,279 | |
| R&D intensity6) | % | 1.04 | 0.86 | 0.84 | |
| Total R&D employees | Persons | 343 | 359 | 312 | |
| Intellectual property rights | Total | Cases | 285 | 257 | 222 |
| Patent | Cases | 250 | 221 | 200 | |
| Utility Model | 6 | 2 | 5 | ||
| Design | 21 | 22 | 12 | ||
| Copyright(Trademark, Others) | 8 | 12 | 5 | ||
| Categories | Unit | 2022 | 2023 | 2024 | |
|---|---|---|---|---|---|
| Business continuity/Contingency risk response test | Counts | 2 | 2 | 2 | |
| DDoS incident response drill | Counts | 1 | 1 | 1 | |
| Disaster recovery drill | 1 | 1 | 1 | ||
| External system security assessment | Counts | 33 | 33 | 34 | |
| Regular security assessment on integrated security center website | Counts | 1 | 1 | 1 | |
| Automated security vulnerability testing for SHI website | 12 | 12 | 12 | ||
| Security assessment on mobile applications/web application | always | always | always | ||
| Pre-update testing for mobile applications/web application | 20 | 17 | 22 | ||
| Internal system security assessment | Counts | 11 | 7 | 9 | |
| Regular security assessment of internal personal data storage systems | Counts | 1 | 1 | 1 | |
| Security assessment on internal applications | always | always | - | ||
| Pre-update testing for internal applications | 10 | 6 | 8 | ||
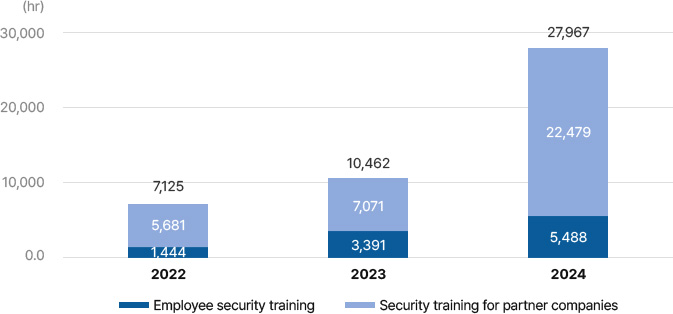
| Total security training | Hr | 7,125 | 10,462 | 27,967 | |
| Employee security training | Hr | 1,444 | 3,391 | 5,488 | |
| Security training for partner companies | 5,681 | 7,071 | 22,479 | ||
| No. | Title | Download |
|---|---|---|
| 1 | Compliance management policy | |
| 2 | Safety & Health Management Policy | |
| 3 | Sustainable Supply Chain Management Policy | |
| 4 | Corporate Governance Charter | |
| 5 | Quality Policy | |
| 6 | Environmental Policy | |
| 7 | Conflict Minerals Policy | |
| 8 | Regulation of Compliance program | |
| 9 | Code Of Conduct | |
| 10 | Supplier Code of Conduct | |
| 11 | 12 Safety Rules | |
| 12 | HSE Policy | |
| 13 | Delaration of Information Security | |
| 14 | Internal Accounting Management Operation Regulations | |
| 15 | ESG Committee Operation Regulations | |
| 16 | Internal Transactions Committee Operation Regulations | |
| 17 | Independent Director Candidate Recommendation Committee Operation Regulations | |
| 18 | Reward and Compensation Committee Operation Regulations | |
| 19 | Audit Committee Operation Regulations | |
| 20 | Management Committee Operation Regulations | |
| 21 | Board of Directors Operation Regulations | |
| 22 | Articles of Association |
| No. | Title | Download |
|---|---|---|
| 1 | 2026 HSE Management Report | |
| 2 | 2025 HSE Management Report | |
| 3 | 2026 Corporate Governance Report(2025 Performance) | |
| 4 | 2025 Sustainability Report(2024 Performance) | |
| 5 | 2025 Corporate Governance Report(2024 Performance) | |
| 6 | 2024 HSE Management Report | |
| 7 | 2024 Corporate Governance Report(2023 Performance) | |
| 8 | 2024 Sustainability Report(2023 Performance) | |
| 9 | 2023 Sustainability Report(2022 Performance) | |
| 10 | 2022 Corporate Governance Reports | |
| 11 | 2021 Sustainability Reports | |
| 12 | 2021 Corporate Governance Reports | |
| 13 | 2020 Sustainability Reports | |
| 14 | 2020 Corporate Governance Reports |
| No. | Title | Download |
|---|---|---|
| 1 | ZWTL (Zero Waste To Landfill) | |
| 2 | Circular Resource Certification (Waste foamed synthetic resin) | |
| 3 | Circular Resource Certification (Waste wood) | |
| 4 | Circular Resource Certification (Other dust) | |
| 5 | Circular Resource Certification (Other slag) | |
| 6 | ISO 27001; Information Security | |
| 7 | ISO 31000; Risk Management | |
| 8 | ISO 37301 & 37001; Compliance & Anti-bribery Management System | |
| 9 | K-EV100 Certification | |
| 10 | ISO 14001; Envrionmental Management | |
| 11 | ISO 50001; Energy Management | |
| 12 | ISO 45001; Occupational Health and Safety | |
| 13 | ISO 9001; Quality Procedures for Quality Management Systems | |
| 14 | ISO 3834-2; Quality Requirements for fusion welding of metallic materials(Comprehensive Quality Requirements) | |
| 15 | ISO 29001; Petroleum, petrochemical and natural gas industries sector-specific Quality Management Systems |
| KOREA | BBB | Medium | C+ | A (E:A, S:A, G:B+) |
B |